-
PRODUCTS & SERVICESOptimized cooling solutions for modern data centersProducts & ServicesOptimized cooling solutions for modern data centers
-
CAPABILITIESAdvancing liquid cooling technologiesCapabilitiesAdvancing liquid cooling technologies
-
TechnologiesLiquid Cooling InnovationTechnologiesLiquid Cooling Innovation
-
RESOURCESLatest News & InformationResourcesLatest News & Information
-
ABOUTOur history, leadership and ownershipAboutOur history, leadership and ownership
-
CONTACTFacility locations and global operational footprint


2026 Best Data Center Energy Efficiency Solutions?
Data Center Energy Efficiency is no longer a side project for operators; it affects capacity, operating costs, and resilience. The best solutions start with measurement, not a glossy equipment promise. Track power usage effectiveness (PUE), but also examine water use and energy per unit of computing work. One number cannot describe everything. A lower PUE may still hide inefficient workloads or heavy cooling demands.
Energy researcher Jonathan Koomey’s work offers a useful caution, paraphrased here: “Efficiency gains can be swallowed by rising demand.” That is worth remembering as AI workloads expand. Practical improvements may include sealing gaps in raised floors, adjusting server inlet temperatures within equipment limits, using variable-speed fans, and matching cooling systems to actual heat loads. Newer UPS units, workload scheduling, and liquid cooling can help in suitable facilities, but each needs careful engineering and operating data. Not every site.
This guide compares solutions by where they help, what they require, and how teams can verify results. It considers retrofit limits, commissioning, maintenance, and the trade-offs behind hardware upgrades. A technology that saves energy in one climate or building may disappoint elsewhere. The ranking is not perfect; facility age, workload patterns, and local power conditions can change the outcome. That matters. Use the recommendations as a starting point, then test them against measured performance and your site’s constraints.
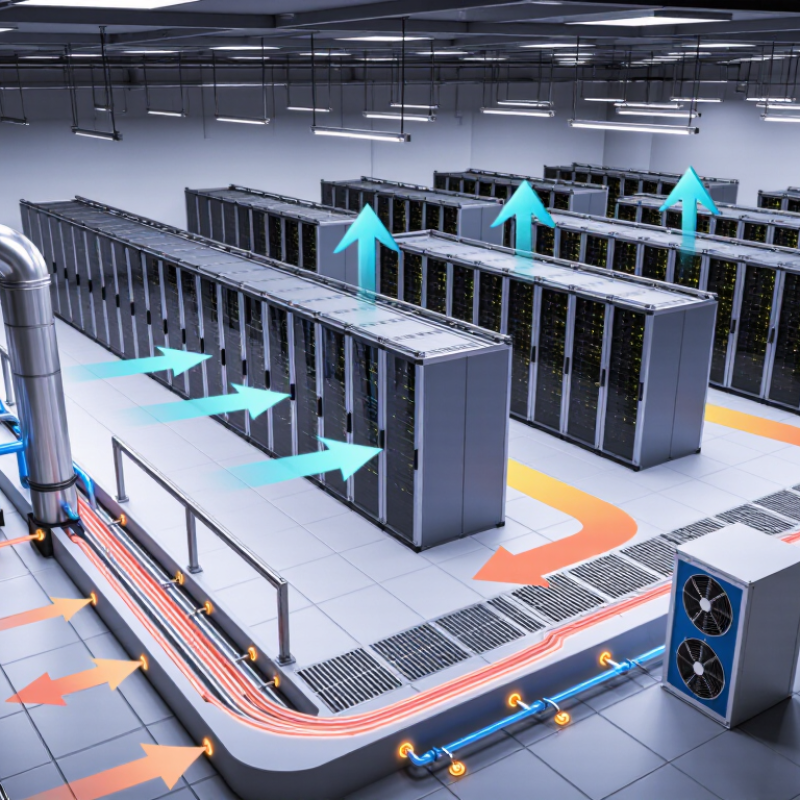
Table of Contents
[Hide]
Data Center Energy Efficiency: Core Principles and Key Metrics
Data Center Energy Efficiency: Core Principles and Key Metrics
Data center efficiency starts with measuring the whole facility, not just the servers. Power usage effectiveness, or PUE, compares total facility energy with energy used by IT equipment. A lower value can indicate less overhead, but it does not prove that computing work is efficient. Check the measurement boundary and season; outdoor temperatures can change cooling demand.
Look beyond one metric. Water usage effectiveness tracks water consumed relative to IT energy, while carbon usage effectiveness relates emissions to IT energy. Also measure energy per useful workload, such as kilowatt-hours per completed transaction. That connects facility performance to what users actually receive. Small changes matter: blanking unused rack spaces, sealing cable openings, and adjusting fan speeds can reduce airflow problems. Keep temperatures within equipment guidance.
Numbers can mislead. A facility may improve PUE while serving fewer workloads, or cut water use while increasing electricity demand. Compare similar operating periods and report both total consumption and workload. Be precise about estimates. Metering gaps are common. Efficiency is not a single score; it is a set of trade-offs that needs regular review.
| Solution | Core principle | Key metric | How to measure or interpret it | Practical implementation focus |
|---|---|---|---|---|
| Airflow management and hot-aisle or cold-aisle containment | Separate hot exhaust air from cold supply air to reduce mixing and avoid unnecessary cooling. | Power Usage Effectiveness (PUE); supply and return air temperatures | PUE = total data center energy ÷ IT equipment energy. A value closer to 1.0 indicates less overhead energy; 1.0 is the theoretical minimum. | Seal gaps, manage blanking panels and cable openings, and monitor temperatures at equipment inlets. Compare PUE over consistent periods and facility boundaries. |
| Cooling set-point optimization and variable-speed controls | Match fan, pump, and cooling output to actual IT heat load while maintaining equipment environmental limits. | Cooling energy; fan and pump power; inlet temperature | Track cooling-system electricity and inlet temperatures over time. Compare against a documented baseline under similar load and weather conditions. | Use calibrated sensors and control sequences; adjust set points gradually and verify that equipment remains within its specified operating conditions. |
| Air-side or water-side economization | Use suitable outdoor-air or ambient-water conditions to reduce mechanical cooling demand. | Economizer operating hours; cooling energy; PUE | Record hours when economization is enabled and the associated cooling energy. Results depend on climate, humidity limits, water availability, and system design. | Assess local weather and water constraints, filtration and humidity requirements, and maintenance needs before selecting an economizer approach. |
| Direct-to-chip or immersion liquid cooling | Remove heat closer to high-density components, potentially reducing air-cooling requirements. | Cooling energy; facility PUE; Water Usage Effectiveness (WUE) | Compare metered cooling and facility energy before and after deployment at comparable IT loads. WUE is commonly reported as annual site water use in liters ÷ IT energy in kWh. | Evaluate rack density, heat-transfer equipment, leak detection, maintenance procedures, water use, and compatibility with IT hardware. |
| High-efficiency UPS and power distribution | Reduce electrical conversion and distribution losses between incoming power and IT equipment. | UPS efficiency; electrical losses; PUE | UPS efficiency = electrical output ÷ electrical input × 100%. Measure at representative loads; efficiency varies with equipment design and operating load. | Use metering at appropriate electrical boundaries and assess operating mode, redundancy requirements, load profile, and equipment specifications. |
| Server consolidation, right-sizing, and utilization management | Deliver required computing work with fewer underused or unnecessarily powered systems. | IT energy; server utilization; energy per unit of useful work | Track IT electricity alongside a workload measure, such as transactions or completed jobs. Higher utilization alone is not proof of better efficiency if service levels decline. | Review idle capacity, virtualization and workload placement, while maintaining performance, resilience, security, and capacity headroom. |
| Workload scheduling and demand-aware operations | Shift flexible computing tasks to times or locations with available capacity or lower-impact energy, when operationally feasible. | Energy per workload; workload completion; carbon emissions | Report energy and emissions for the same defined workload. Carbon emissions depend on electricity consumption and the chosen grid-emissions accounting method. | Identify deferrable workloads and verify that scheduling does not compromise latency, service availability, data rules, or recovery requirements. |
| Heat recovery and reuse | Capture usable waste heat for nearby buildings or processes instead of rejecting all heat to the environment. | Recovered heat; energy reuse factor (ERF) | ERF = reused energy ÷ total data center energy, using clearly stated measurement boundaries. Report heat quantity, temperature, and delivery period. | Assess proximity to heat users, seasonal demand, required temperatures, heat-pump energy, and the reliability of the heat connection. |
| On-site renewable generation and electricity procurement | Reduce the emissions associated with electricity use through renewable generation or qualifying electricity purchases. | Renewable electricity share; carbon emissions per IT energy | State the accounting method, time period, and boundary. Carbon Usage Effectiveness (CUE) is commonly expressed as total data center CO₂e emissions ÷ IT energy. | Distinguish on-site generation, contractual purchases, and grid electricity; document how renewable claims and emissions factors are calculated. |
| Continuous metering, monitoring, and operational analytics | Use consistent data to identify losses, verify changes, and detect drift from efficient operating conditions. | PUE, WUE, CUE, IT load, and energy per workload | Use recognized metric definitions, documented measurement boundaries, calibrated meters, and consistent reporting intervals. Compare like with like. | Submeter major loads, maintain data quality, and review trends alongside weather, IT load, maintenance events, and service requirements. |
Note: No single solution is best for every facility. Results depend on climate, site design, IT workload, local water conditions, operating requirements, and measurement boundaries. Establish a measured baseline before claiming savings.
Related Posts
-
Top 10 Data Center Thermal Management Solutions in China Explained
-

2026 Top Trends in Data Center Thermal Management Solutions?
-
How to Optimize Data Center Thermal Management for Improved Efficiency?
-
Effective Strategies for Data Center Thermal Management?
-

What is AI Data Center Cooling and How Does It Work?
-
What Is Supercomputer Cooling and Why Does It Matter?